Population
|
Population: 0.6 million
Density: 908 people per sq km Net Migration Rate: 19 migrants per 1,000 people Birth Rate: 11 births per 1,000 people Death Rate: 7 deaths per 1,000 people Rate of Natural Increase: 4 per 1,000 people Population Growth Rate: 2.3% Infant Mortality Rate: 4.28 deaths per 1,000 live births Total Fertility Rate: 1.57 births per woman Percent of Population Age < 15: 17% Percent of Population Ages 65+: 14% Dependency Rate: 31% Life Expectancy at Birth: 82.17 years Life Expectancy at Birth for Females: 84.76 years Life Expectancy at Birth for Males: 79.73 years Primary School Completion Rate for Females: 85% Primary School Completion Rate for Males: 83% Secondary School Enrollment Net for Females: 87% Secondary School Enrollment Net for Males: 82% GNI PPP Per Capita: $57,830 Economically Active Females 15+: 48% Economically Active Males 15+: 63% Mobil Phone Subscribers: 148 subscriptions per 100 people Motor Vehicles: 747 motor vehicles per 1,000 people Undernourished Population: 5% Underweight Children Under 5: N/A HIV/AIDS Among People 15-49: 0.3% |

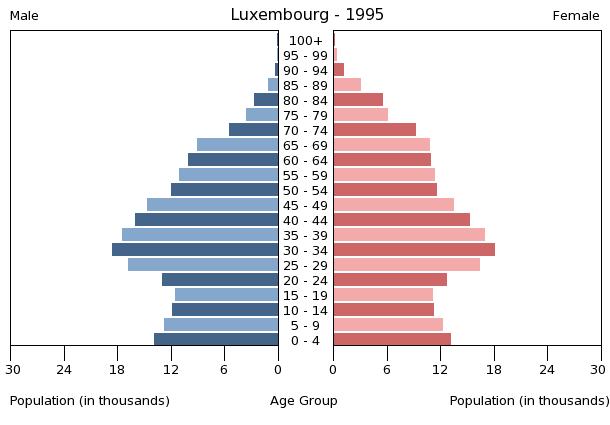
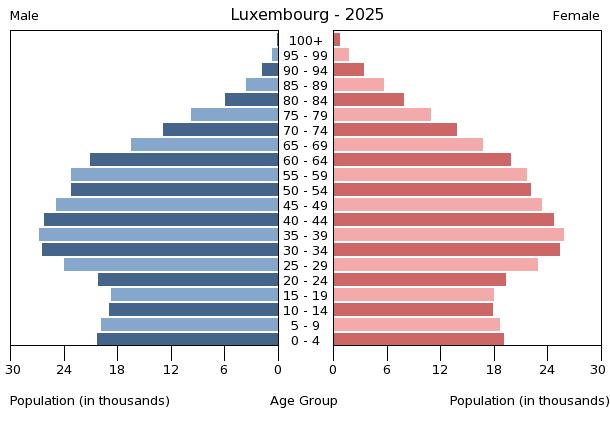
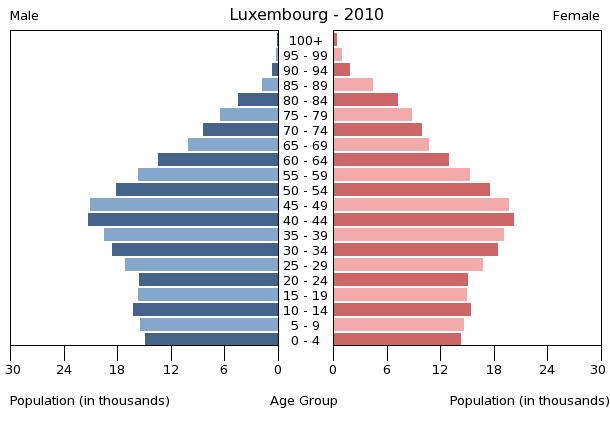
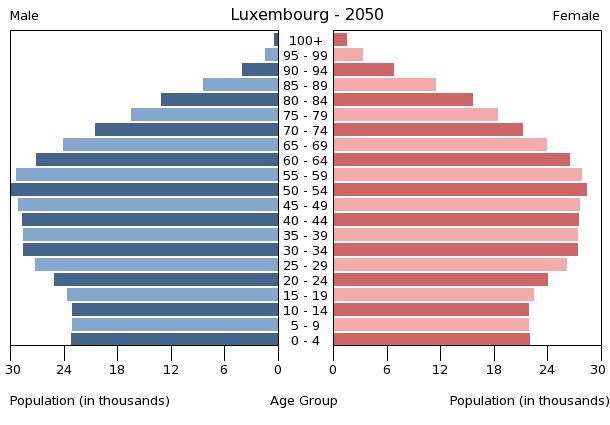
Based off of the Population Pyramids below, the statistics to the left, and the understanding of the Demographic Transition Model; it can be inferred that Luxembourg is in Stage 4 of the Demographic Transition Model. This stage can be justified by the fact that Luxembourg's Rate of Natural Increase is 4 per 1,000 people, and Stage 4 will demonstrate a low Natural Increase Rate. Also, the Death Rate of 7 deaths per 1,000 people is considered low. Stage 4 of the Demographic Transition Model will display that type of data. Lastly, the Population Growth Rate is 2.3% which is near stable; Stage 4 is the stage that will show a stable Population Growth.
|
|
|
The above 4 images show Population Pyramids for Luxembourg in 1995, 2010, and projections for the years 2025 and 2050.
