Population
|
Population: 7.2 million
Density: 216 people per sq km Net Migration Rate: -0.29 migrants per 1,000 people Birth Rate: 8.92 births per 1,000 people Death Rate: 14.44 deaths per 1,000 people Rate of Natural Increase: -5.52 per 1,000 people Population Growth Rate: -0.6% Infant Mortality Rate: 8.66 deaths per 1,000 live births Total Fertility Rate: 1.45 births per woman Percent of Population Age < 15: 21.5% Percent of Population Ages 65+: 30.4% Dependency Rate: 51.9% Life Expectancy at Birth: 74.30 years Life Expectancy at Birth for Females: 77.93 years Life Expectancy at Birth for Males: 71.05 years Primary School Completion Rate for Females: 89% Primary School Completion Rate for Males: 91% Secondary School Enrollment Net for Females: 86% Secondary School Enrollment Net for Males: 86% GNI PPP Per Capita: $15,850 Economically Active Females 15+: 48% Economically Active Males 15+: 59% Mobil Phone Subscribers: 137 subscriptions per 100 inhabitants Motor Vehicles: 353 motor vehicles per 1000 Undernourished Population: 5% Underweight Children Under 5: 1.6% HIV/AIDS Among People 15-49: 0.1% |
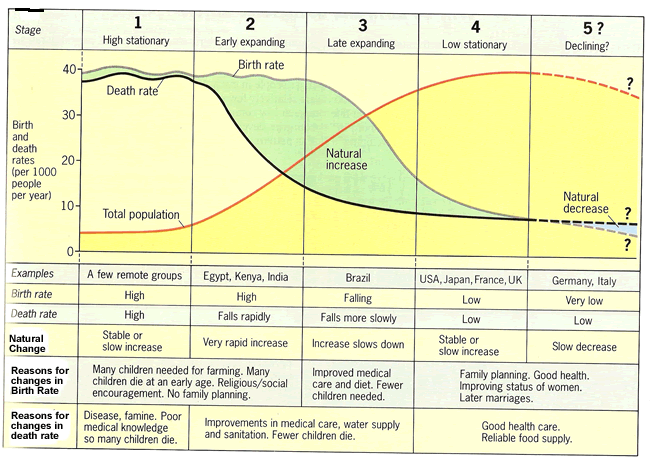
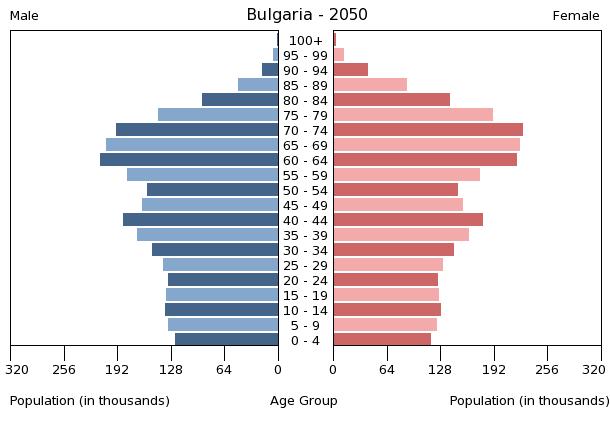
Based off of the Population Pyramids below, the statistics to the left, and the understanding of the Demographic Transition Model; it can be inferred that Bulgaria is in Stage 5 of the Demographic Transition Model. This stage can be justified by the fact that Bulgaria's Rate of Natural Increase is -5.52 per 1,000, and Stage 5 is the only stage that will demonstrate a negative rate of natural increase. Also, the Birth Rate of 8.92 births per 1,000 people is lower than the Death Rate of 14.44 deaths per 1,000 people. Stage 5 is the only Demographic Stage that will display that type of data. Lastly, the Life Expectancy at Birth for Females is 77.93 years, Stage 5 is the only stage that will show a life expectancy above the age of 75 years.
|
|
|
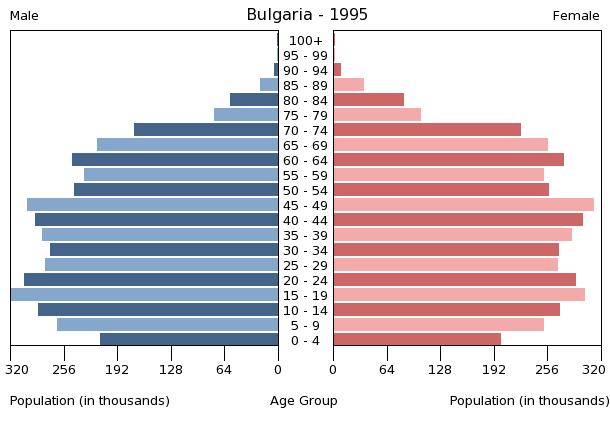
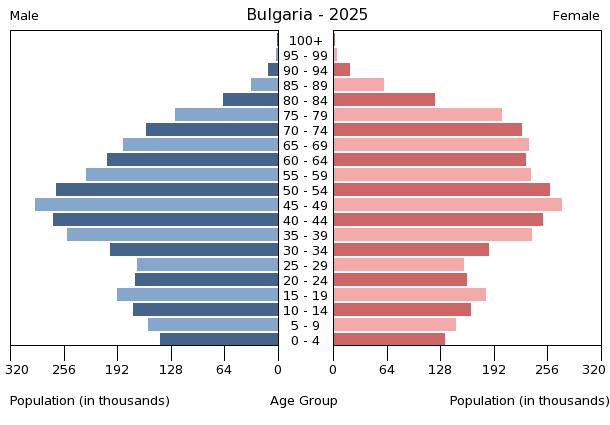
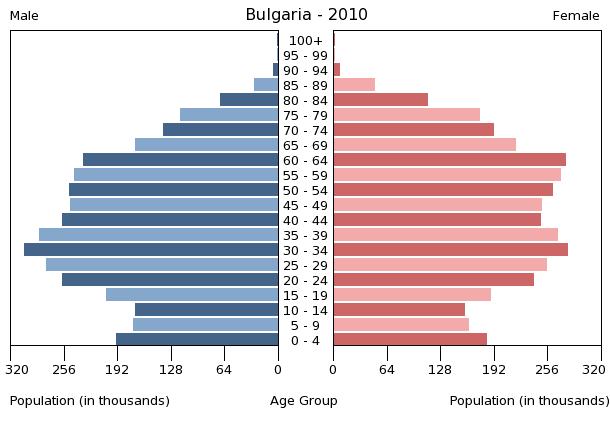
The above 4 images show Population Pyramids for Bulgaria in 1995, 2010, and projections for the years 2025 and 2050.
