Population
|
Population: 0.5 million
Density: 1,090 people per sq km Net Migration Rate: -2 migrants per 1,000 people Birth Rate: 21 births per 1,000 people Death Rate: 6 deaths per 1,000 people Rate of Natural Increase: 15 per 1,000 people Population Growth Rate: 0.9% Infant Mortality Rate: 41.3 deaths per 1,000 live births Total Fertility Rate: 2.33 births per woman Percent of Population Age < 15: 31% Percent of Population Ages 65+: 6% Dependency Rate: 37% Life Expectancy at Birth: 71.85 years Life Expectancy at Birth for Females: 74.19 years Life Expectancy at Birth for Males: 69.58 years Primary School Completion Rate for Females: 87% Primary School Completion Rate for Males: 87% Secondary School Enrollment Net for Females: 75% Secondary School Enrollment Net for Males: 21.8% GNI PPP Per Capita: $6,320 Economically Active Females 15+: 54% Economically Active Males 15+: 81% Mobil Phone Subscribers: 122 subscriptions per 100 people Motor Vehicles: 94 motor vehicles per 1,000 people Undernourished Population: 10% Underweight Children Under 5: 1.8% HIV/AIDS Among People 15-49: 1% |
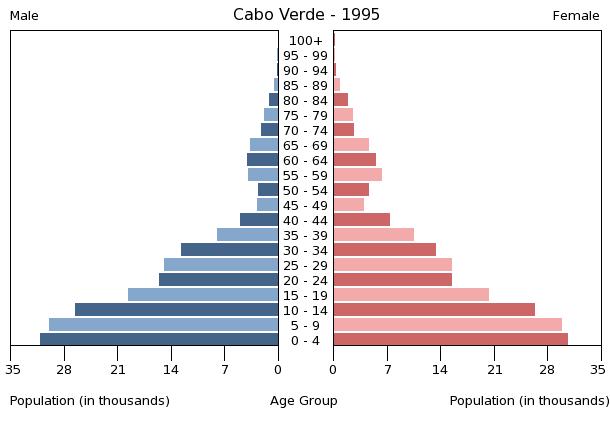
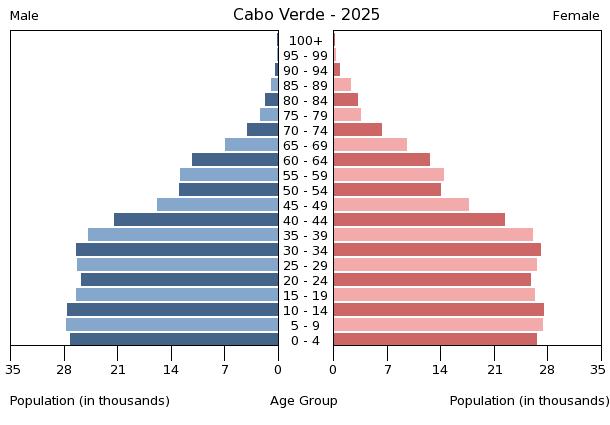
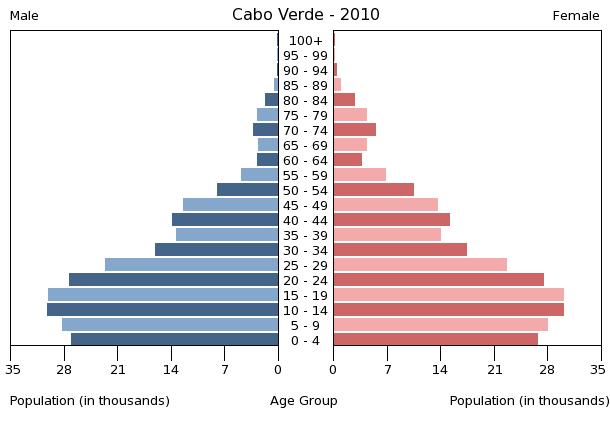
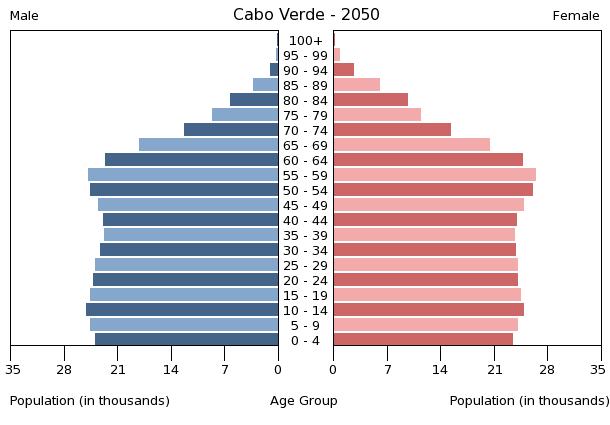
Based off of the Population Pyramids below, the statistics to the left, and the understanding of the Demographic Transition Model; it can be inferred that Cape Verde is in Stage 4 of the Demographic Transition Model. This stage can be justified by the fact that Cape Verde's Population Growth is 0.9%, and Stage 4 will demonstrate a stable and low Population Growth. Also, the Death Rate of 6 deaths per 1,000 people is considered low. Stage 4 of the Demographic Transition Model will display that type of data. Lastly, the Life Expectancy at Birth is 71.85 years, the Life Expectancy at Birth for Females is 74.19 years, and the Life Expectancy at Birth for Males is 69.58 years; Stage 4 is the stage that will show a life expectancy 65-75 years.
|
|
|
The above 4 images show Population Pyramids for Cape Verde--also known as Cabo Verde--in 1995, 2010, and projections for the years 2025 and 2050.
